Did you know that you can navigate the posts by swiping left and right?
Computer Science approximation of the human visual system
07 Sep 2022
. category:
Computer Vision
.
Comments
#plenoptic function
#light field function
#lumigraph
Light Field Function
The light field function has its origins in the plenoptic function. The two concepts are often used together or even mixed up which might be confusing. In order to understand the light field function we would first have to understand the concept on which it is based, namely the plenoptic function.
Plenoptic Function
The plenoptic function was introduced by Adelson and Bergen in 1991 [1]. The idea behind the plenoptic function is that it is a systematic overview of how the structures in the human visual system relate to the visual information in the world.
If you’re familiar with the levels of Marr, then we could argue that the plenoptic function is at the computational level.
Since we are dealing with the human visual system it is only natural to use the human eye as an observer. The rays of light in a scene pass through the pupil of the eye and the ability to capture visual information is therefore limited in the direction from which the light rays originate. Or in other words, you cannot see through the back of your head. However, let’s remove this limitation and add the assumption that we have an eye that is capable of capturing light from all directions (360 $^\circ$). We have now arrived at the plenoptic function which describes all the visual information available to an observer from every point in space and time.
![Visualization of 360 $^\circ$ observer taken from [1]](/img/lightfields/plenoptic_function_eye.png) Figure 1. Visualization of the Plenoptic Function for a 360 $^\circ$ observer taken from [1]
Figure 1. Visualization of the Plenoptic Function for a 360 $^\circ$ observer taken from [1]
Now that we have a high level overview of the plenoptic function, we can define some terms. The first one is the term visual information. In the case of the plenoptic function visual information relates to the intensity distribution of the rays of light that pass through the observer (eye). The most simple parameterization of the plenoptic function is therefore, $\mathbf{P}\bigl(\theta, \phi\bigr)$, where $\mathbf{P}$ is the intensity distribution of the light rays, $\theta$ and $\phi$ are the spherical coordinates (polar angle and azimuthal angle) which parameterize the rays that pass through the eye.
Let’s extend the parameterization in two ways, we add the color of the rays and consider a sequence of pictures instead of a single image. Thus, we add wavelength $\lambda$ and the time dimension $t$ to the current parameterization, we now have $\mathbf{P}\bigl(\theta,\phi,\lambda,t\bigr)$.
There is one last thing we should not forget and that is to add the parameters of the viewpoint (eye). The viewpoint, $V$, consists of three dimensions, $V_x, V_y, V_z$ and the plenoptic function becomes $\mathbf{P}\bigl(\theta,\phi,\lambda,t,V_x,V_y,V_z\bigr)$. The plenoptic function now describes the intensity of all rays observed by an observer for every point in time and space.
Light Field
The plenoptic function is useful in the sense that it is a more formal description of the human visual system from a computer science perspective. However, at this point it is a rather complex 7D function. Fortunately, we can simplify the function by adding some assumptions. First, we assume that there is no dispersion of light and that the color of a ray remains constant. Next, we eliminate the time parameter $t$, by only considering a specific moment in time (a snapshot). The resulting parameterization is $\mathbf{P}\bigl(\theta,\phi,V_x,V_y,V_z\bigr)$, which might look familiar if you have experience with light rays and ray tracing.
A simplification from 7D to 5D is interesting, however, we have not arrived yet at the definition of the light field function. In 1996, a group of scientists came up with an interesting idea to place the scene in a transparent cube [2]. Now, we can limit our focus to the surface where a light ray enters and leaves the cube. In other words, a ray passes through a plane $(s,t)$, through the object, and exits through the plane $(u,v)$. We are only interested in the 2D positions of the point on the plane $(s,t)$ and $(u,v)$ and thus the parameterization consists of two 2D points. The result is a 4D function also referred to as the Light Field Function or Lumigraph.
It is actually a bit more nuanced because in the light field function the scene is placed in a concave object and in the Lumigraph it is placed in a cube. However, these differences are mostly interesting when thinking about alternative parameterizations of the light field, e.g. a sphere or curved surface instead of a cube.
![The Light Field Function taken from [2]](/img/lightfields/lumigraph_2dparameterization.png) Figure 2. Simplified overview of the Lumigraph taken from [2]
Figure 2. Simplified overview of the Lumigraph taken from [2]
In short, the Light Field is a function that maps the color to each ray that intersects with the scene.
Receptive Fields
The plenoptic function itself does not necessarily have many practical applications. However, as mentioned earlier it is an approximation of the human visual system, and we know that the human visual system contains so called receptive fields. These receptive fields “fire” when they encounter certain shapes (circles, squares etc.) or edges. Let’s simplify the plenoptic function $\mathbf{P}\bigl(x,y, \theta,t,V_x,V_y,V_z\bigr)$ one more time, instead of spherical coordinates $\theta, \phi$ we use cartesian coordinates $x,y$. The cartesian coordinate notation is often used in computer vision and it represents the spatial coordinates of an image, or in other words the pixels. We can extract interesting information from the plenoptic function by calculating the derivate with respect to certain parameters. In order to extract the information, we first compute the local average and then the derivative (see [1] for an in depth explanation). In other words, we apply a smoothing function (gaussian) on an image (Figure 3) and then convolve it with a kernel (Sobel).
 Figure 3. A simple image of a rectangle on the plane $\bigl(x,y\bigr)$
If you have a signals processing background or experience with convolutional neural networks, then this approach might sound familiar. The explanation that follows is in essence the application of Sobel filters on images.
If we calculate the derivative with respect to $x$ or $y$, we can extract the horizontal and vertical information in the image. We could also do the same for the diagonal direction, by deriving with respect to $x+y$. Furthermore, we can derive to different combinations of parameters to extract different visual information. However, the derivatives with respect to $x$ and $y$ are the most practical to discuss since the other options are not trivial to implement and are more or less idealized receptive fields (see [2] page 10 ).
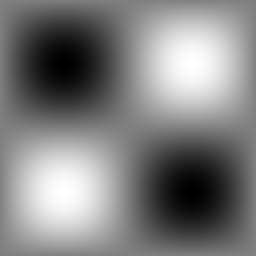
| $D_x$ | $D_y$ | $D_{yx}$ | Laplacian |
 |
 |
 |
 |
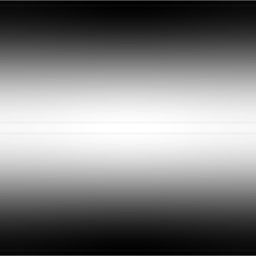
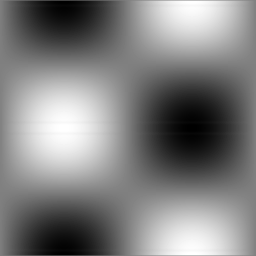
| $D_{xx}$ | $D_{yy}$ | $D_{yyx}$ | $D_{yyxx}$ |
 |
 |
 |
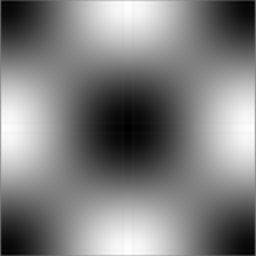 |
Table 1. An overview of the receptive fields which are the results of the derivatives of the plenoptic function. The $D$ notation represents the derivative and $D_{xx}$ is the second derivative w.r.t. x, notation is copied from [2]
In the table 1, we can see the receptive fields and when they are activated. We can see that $D_x$ and $D_y$ activate for horizontal and vertical edges, respectively. The diagonal information can be extracted by deriving with respect to $y$ and $x$. The Laplacian is actually the sum of $D_{xx}$ and $D_{yy}$, it is the sum of the second order derivates in the horizontal and vertical direction. The receptive fields are interesting because they can also be described as feature detectors or kernels. These kernels are convolved over the image and the rate of activation depends on whether the features that the kernel is sensitive for exist in the image. The key point to remember is that the receptive fields act as feature detectors (kernels), and stem from the early stages of visual processing in the human visual system.
The convolutional neural networks (CNN) could be described as stacked layers of feature detectors and the idea for this approach comes from the human visual system.
This has mostly been a theoretical review of the plenoptic function, however, the Lumigraph is a rendering function based on the plenoptic function. If you are interested in applying the theory, I would like to refer you to section 3 of [2] which provides information to implement the Lumigraph System (algorithmic level).
Tying it all together
We have covered the theory behind the Plenoptic Function, Light Field and Lumigraph. We have also explained how we can extract visual information from the Plenoptic Function in a manner that resembles how the human visual system works. The plenoptic function is interesting because it is a continuous 3D representation of a scene. It is a computational model of how vision works, translating this model to the algorithmic and implementational level would give you the ability to construct Light Fields for a scene and render all views of that scene. In the upcoming articles we will continue with continuous 3D representations and explore how neural networks can be used to construct the Light Field of a certain scene.
To summarize, we started at the computational level with the Plenoptic function which describes the human visual system from a computer scientists perspective. We continued with a simplification of the plenoptic function, resulting in the Light Field and Lumigraph. The Light Field is still at the computational level whereas the Lumigraph contains an actual rendering framework. However, we will explore other 3D rendering frameworks in future work and the concepts in this article have been introduced as background knowledge for these 3D representations.
References
[1] Edward H Adelson and James R Bergen. The plenoptic function and the elements of early vision, 1991.
[2] Michael Cohen, Steven J. Gortler, Richard Szeliski, Radek Grzeszczuk, and Rick Szeliski. The lumigraph. Association for Computing Machinery, Inc., August 1996.